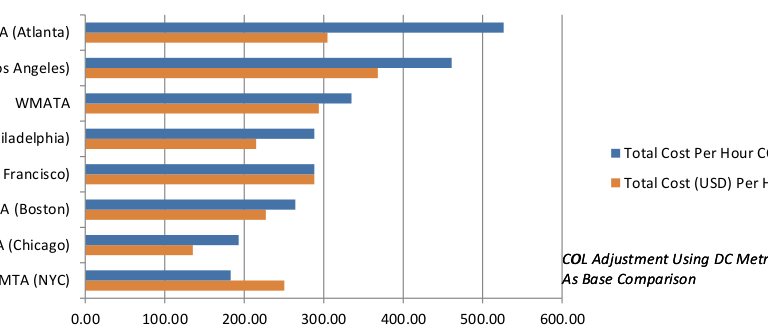
The following charts were created using data from National Transit Database information located here and is based on the latest full year data for all jurisdictions. Cost of living (COL) was derived from payscale.com.
Major takeaways from the data. WMATA systems cost more on a personnel and on a total operation basis for rail & bus compared to the equally large systems of MTA (New York) and CTA (Chicago) when cost of living factors have been adjusted.
Comparing WMATA bus service to other local jurisdictions, there is a much higher cost per mile and per hour of service compared to ART, Fairfax Connector, and Montgomery County. The combination of ART, Fairfax Connector, and Montgomery County constitutes approximately 50% the service size of WMATA. If personnel and administration operations of buses were changed from WMATA employees to be split equally between the above three jurisdictions there would be an $89.5 million in cost savings per year.
That would allow for the purchase of 40 new 7000 series cars per year, helping to replace the out of date aging stock. It would allow for a 25% increase in bus service (frequency or coverage). It would provide a source of funds for much needed core improvements within the next decade including station upgrades that could help reduce delays caused by broken down rail cars.
Certainly some food for thought when considering the merits of employee wages and benefits versus the needs in the system.
Rail Systems (LR/HR) – Personnel Cost Per Revenue Mile
Rail Systems (LR/HR) – Personnel Cost Per Revenue Hour
Rail Systems (LR/HR) – Total Cost Per Revenue Hour (inc. Vehicle Maintenance)
Bus Systems – Personnel Cost Per Revenue Mile
Bus Systems – Personnel Cost Per Revenue Hour
Bus Systems – Total Cost Per Revenue Hour (inc. Vehicle Maintenance)


