Today DCInno had a really great article which included data from RentHop regarding average rental prices and year over year change in those rents by metro station. Take a tour of the interactive map below, which provides good insight regarding the effects of development on affordability.
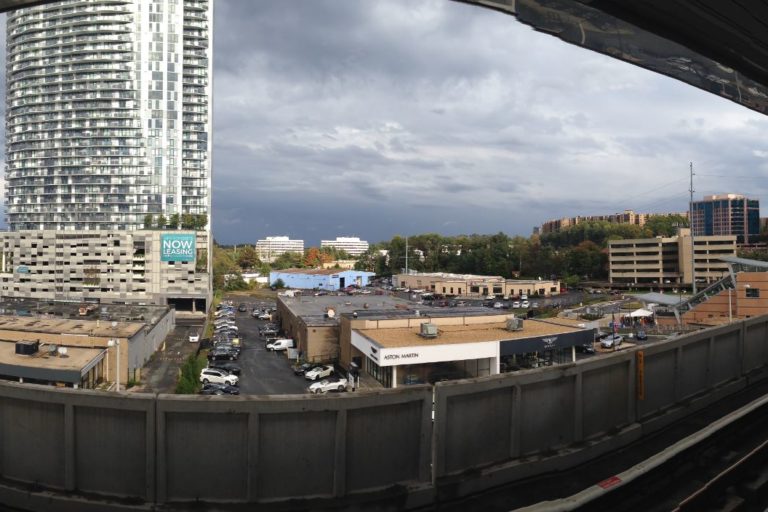
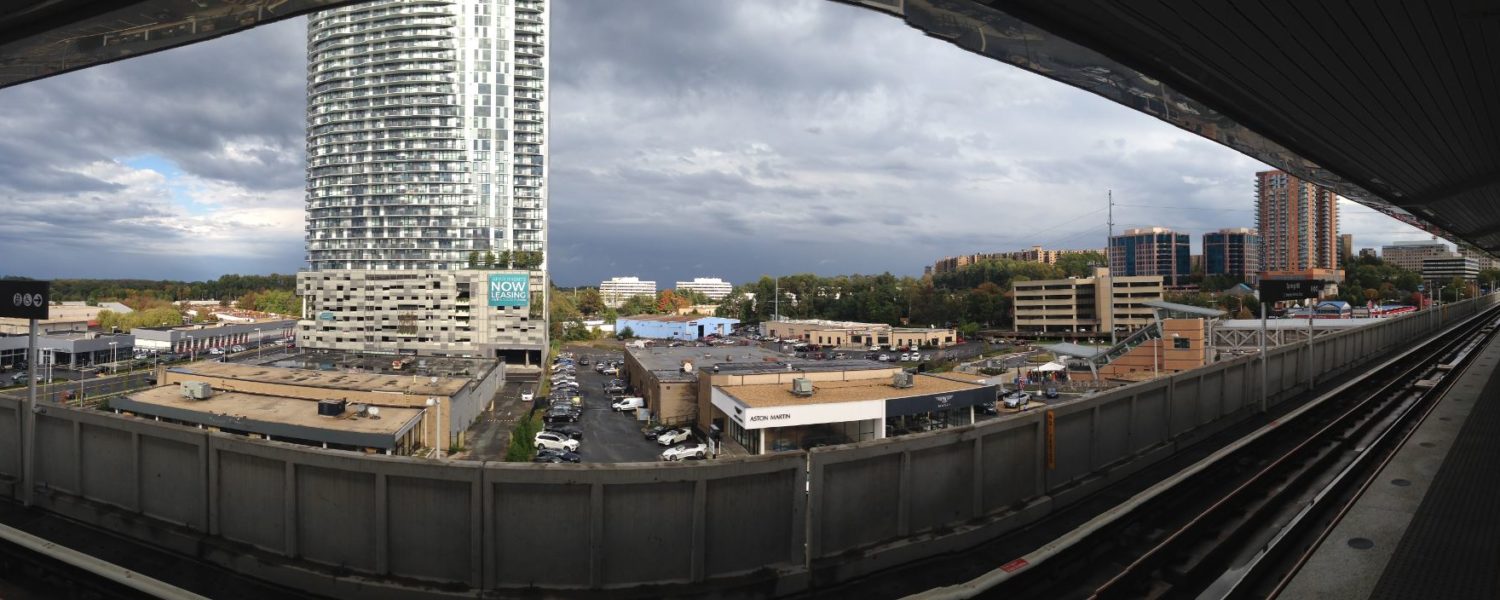
It is an oft repeated criticism that the rise of multi-family construction inside the beltway is increasing prices and forcing people out. With the data provided by RentHop we can take a look at that criticism in light of the residential construction boom Tysons has undergone the past 3 years. Tysons is one of the leading development zones for apartments in the DC region. Several of the region’s biggest apartment complexes have come to Tysons these past 3 years, and several more are on the horizon.
The DC equivalent to the construction boom would be at NoMa station or at the Waterfront. Whereas the antithesis of this development boom would be locations like DuPont or Van Ness in upper Northwest DC, where community opposition has all but halted any new development.
In Tysons, the current average rents are $1650, $1700, $1650, and $1495 from Spring Hill to McLean Station. At NoMa rents are $2135 and at the Waterfront $2050. DuPont and Van Ness are $2300 and $1920 respectively. Clearly the DC metro stations benefit from proximity to the center city, but all things being relative, the year over year numbers are more informative.
In Tysons, the year-over-year change is -7.1%, +0.9%, 3.9%, and 3.1% from Spring Hill to McLean Station. Spring Hill Station, based on the past year, saw the biggest drop. However, with the delivery of Adaire, Ascent and Avalon Park Crest, Spring hill has seen the glut of new construction in Tysons over the past three years.
Although a lot of construction has happened at McLean Station, most of that delivered at the late stages of this data, and likely had limited affect. In DC NoMa’s rent bucked the citywide trend and also fell -7.2% and the Waterfront -3.9%. Meanwhile the more restrictive DuPont rose 4.5% and Van Ness 5.5%.
One data point on the long calendar of development doesn’t tell you everything, and remains anecdotal. There are many influences on why a property may price at a certain time, what matters is trends. Hopefully RentHop keeps up with the data and we can see how the development boom is affecting affordability with next year numbers as well.


